
- Client
- Confidential
- Industry
- EdTech, K-12 assessments
- Location
- United States
- Company size
- Over 500 employees
The situation
The client is a US EdTech company with over 500 employees. It provides standardized assessments, progress monitoring tools and clinical evaluations for the K-12 market. The company grows through acquisitions, and each acquired brand arrived with its own website, its own CMS and its own SEO debt.
When we started in 2023, the first property we took on was an acquired social-emotional learning platform. It had never been properly optimized. The average position in Google Search Console was 46, and after 7 years of operation the site ranked for roughly 50 keywords.
In late May 2025 the company moved its main corporate website from Shogun to HubSpot CMS, and the migration failed. The old site used dynamic filters for product categories. On HubSpot, each filter combination became a static URL, which turned a manageable structure into 66,500 indexed junk pages. The site also carried a noindex tag for over two weeks, so Google was removing pages from its index.
Visibility fell from 26% to 11%. Total links jumped from 824,000 to nearly 9 million. The audit showed 655 errors and 197,584 warnings, and the site was at risk of a Google penalty.
Organic search brings 29% of the company’s online customers and direct traffic brings another 57%. Together that is 86% of all online customers, so a loss of search visibility would have hit the main revenue channel.
What we did
The engagement grew in phases. We started with one property in 2023 and expanded to all three by early 2025. When the migration failed, we moved to emergency recovery.
Phase 1: build the foundation (2023 to 2024)
We began with the acquired social-emotional learning platform: a full technical audit, keyword research against five competitors, a new site architecture and page by page on-page optimization. The site went from roughly 50 ranked keywords to over 1,600 keywords in the top 50.
Phase 2: scale to three properties (January to June 2025)
We onboarded a progress monitoring site from zero, with keyword research across 4,741 keywords and 5 competitors. Technical optimization fixed 385 errors and 1,751 warnings and reduced the site from 1,445 pages to 212.
On the first property we ran on-page optimization with weekly delivery: 110 pages by mid-April, 128 by late May and 143 by the end of June. Average on-page scores went from 42% to 88%. First-page rankings in Google grew from 61 to 352, against competitors with ten times more backlinks.
Phase 3: migration recovery (August to November 2025)
We restructured the architecture of the main site, wrote a new robots.txt and rebuilt the sitemap. The work focused on crawl budget: static filter URLs came out of the index and only the pages that mattered stayed. We fixed 65,490 dynamic URLs and removed 39 redirect chains.
Visibility recovered from 11% to 16% within weeks, above the level before the migration. We then optimized 18 core pages on the main site, where on-page scores rose from 37.4% to 83.15%, and won 267 keywords in the top 20.
Throughout the project we coordinated with over 10 people across the client’s marketing team, IT team and an external eCommerce development agency.
The numbers
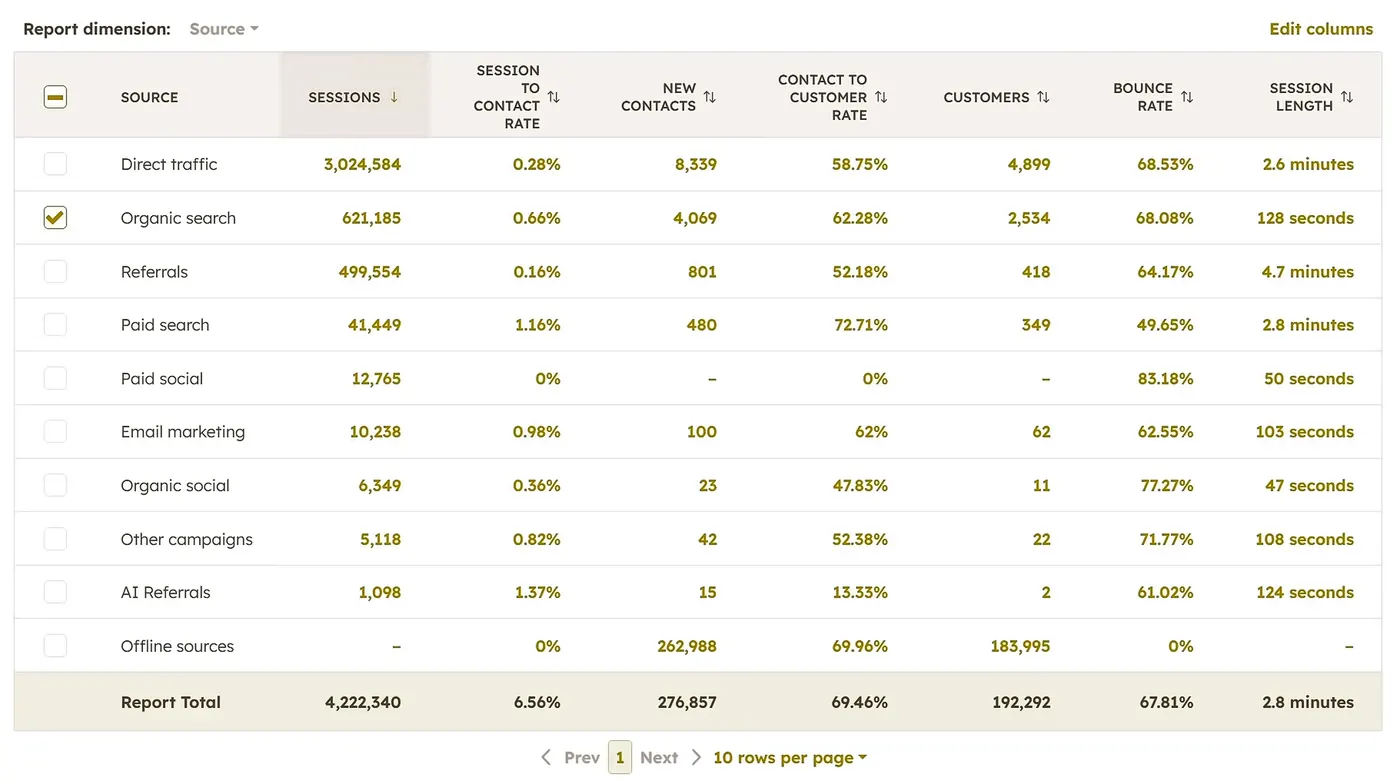
Organic search delivers a higher quality audience than direct traffic: a 0.66% contact rate against 0.28%, and a contact to customer rate of 62.28%. Paid search brought 41,449 sessions and 349 customers at a 72.71% contact to customer rate.
The same report shows an early AI search signal. 1,098 sessions came from AI referrals such as ChatGPT and Gemini, with a 1.37% contact rate. That is twice the rate of classic organic search.
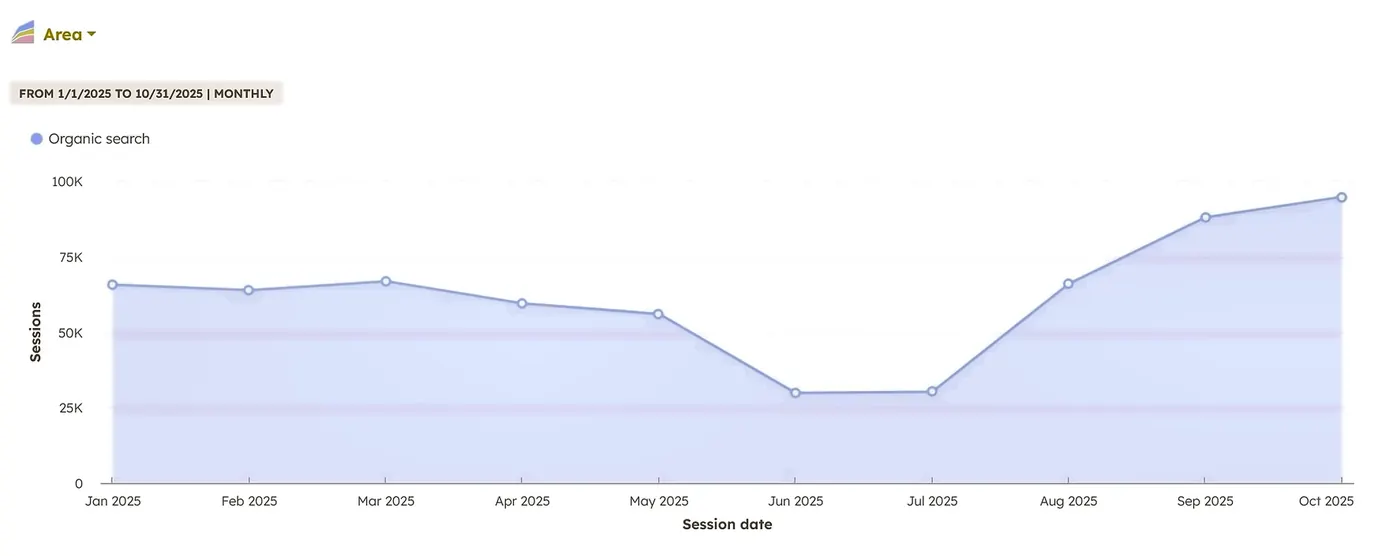
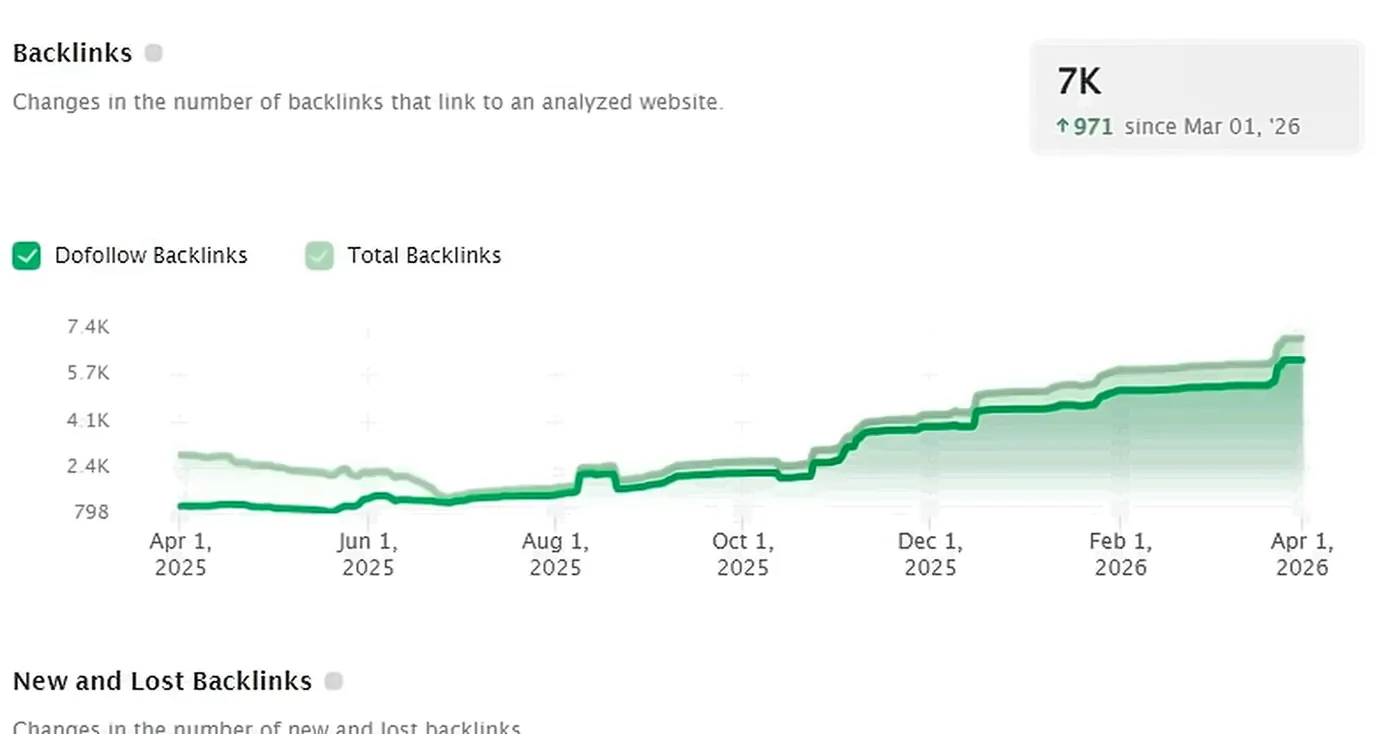
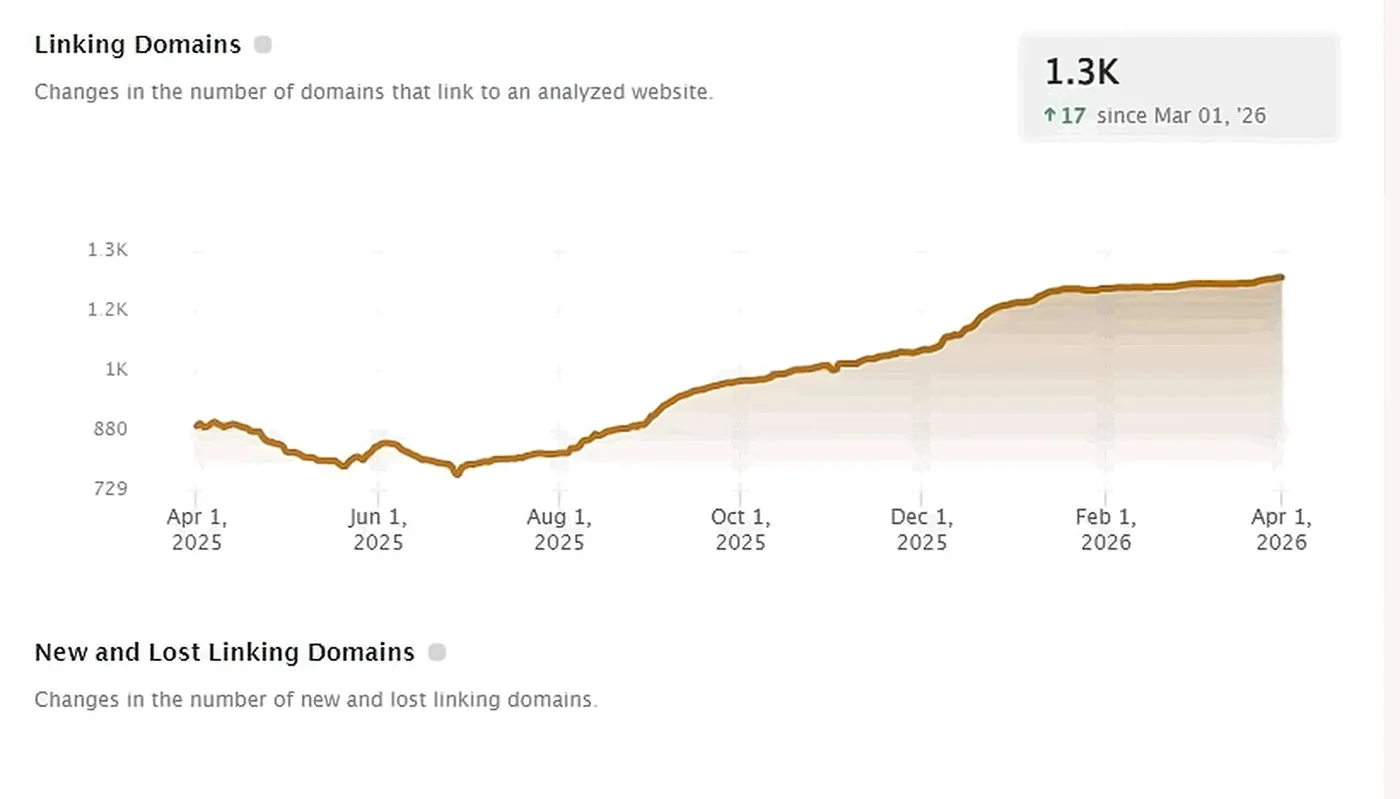
Organic sessions started the year at around 65,000 a month and dropped to roughly 30,000 in June and July, after the failed migration. June and July are peak season in K-12 assessments, because schools buy before the new academic year. After the recovery, traffic climbed to over 95,000 sessions by October.
Technical recovery: before and after
| Metric | Before | After | Change |
|---|---|---|---|
| Pages indexed | 66,517 | 324 | −99.5% |
| Total links | 8,835,232 | 319,005 | −96.4% |
| Errors | 655 | 120 | −81.7% |
| Warnings | 197,584 | 638 | −99.7% |
| 4xx status codes | 182 | 64 | −64.8% |
| Broken links | 1,283 | 259 | −79.8% |
| Dynamic URLs | 65,490 | 0 | −100% |
| Redirect chains | 39 | 0 | −100% |
| Visibility | 11% | 16% | +45% |
Paid search
SEO and paid search ran on one keyword strategy. Paid search held visibility on high-competition keywords while organic rankings were building, and it kept traffic flowing to the site during the recovery.

Total spend across the engagement was $33,724. The average cost per click of $0.44 compares with an industry average of around $8 for education and assessment terms. The campaigns generated 455 contacts and 147 deals.
Key takeaways
- A migration needs an indexation plan before launch. Here, product filters became static URLs and produced 66,517 indexed pages.
- Crawl budget comes first in a recovery. Once the junk URLs were out of the index, visibility moved within weeks.
- Paid search can hold traffic while organic recovers, at low cost when the two share one keyword strategy.
- Reporting from the CRM shows what search is worth: organic visitors converted to contacts at more than twice the rate of direct traffic.
Our role
One team handled strategy, technical SEO and paid search. The client expanded the scope from one property to three during the engagement, and later invited us to lead an internal session on eCommerce SEO for its store migration.
Frequently asked questions
How long did the recovery take?
About 90 days. Organic sessions went from roughly 30,000 a month in June and July 2025 to over 95,000 by October.
What caused the drop in traffic?
The migration turned each product filter combination into a static URL, which produced 66,517 indexed pages. The site also carried a noindex tag for over two weeks.
What did the paid search campaigns return?
Total spend was $33,724 at an average cost per click of $0.44. The campaigns generated 455 contacts and 147 deals, a 608% ROI.