- Client
- Confidential
- Industry
- Cybersecurity compliance, audit
- Markets
- United States and United Kingdom
- Company size
- 501 to 1,000 employees
The situation
The client audits and certifies companies against security and compliance standards. It sells several services to different buyers, and each department has its own sales targets.
In 2017 the company had no Google Ads account and no data on paid search as a lead channel. It sold in two markets, the US and the UK, with different demand and different competitors.
Project goal
Start with a proof of concept. Can paid search bring qualified traffic and contact form submissions at an acceptable cost? If the answer is yes, scale the account across services and markets.
What we did
A new account with no history
We started from an empty account. First we learned which services bring revenue and who buys them. The campaign plan came from that.
Different targets per department
Each department had its own KPIs, so each campaign got one objective. Budget and targeting changed with the department’s goal for each period.
Two markets
Buyers in the US and the UK search differently and respond to different messages. Each market had its own campaigns, keywords, ads and bids.
The proof of concept worked in the first year. The client kept the engagement running for six more years.
Account structure
We used two campaign types. Search campaigns reached people who were already looking for the client’s services. Display campaigns kept the brand in front of them after they left the search results.
In the United States, each key service had its own Search campaign, and a Display campaign retargeted website visitors. In the United Kingdom, separate Search campaigns covered the services with local demand, and a Display campaign targeted people researching compliance solutions.
Optimization and monitoring
We added keywords and negative keywords and rewrote ads around the best-performing terms. A/B tests showed which ad versions to keep. Most keywords started with a Quality Score of 2 or 3, and all active keywords ended above 7.
Bids were adjusted by device, location and time of day. On Display, we moved budget toward the placements that performed.
The numbers
Seven years of account data, taken from Google Ads.
| Year | Cost | Conversions | Cost per conversion | Change in conversions |
|---|---|---|---|---|
| 2017 | $427,700* | 206 | $2,076* | |
| 2018 | $1,553,790 | 1,197 | $1,297 | +481% |
| 2019 | $2,037,567 | 1,196 | $1,703 | 0% |
| 2020 | $2,153,599 | 4,197 | $513 | +251% |
| 2021 | $2,666,518 | 2,263 | $1,178 | −46% |
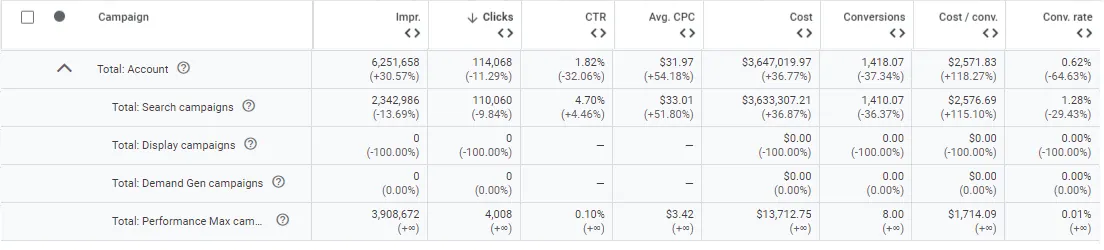
| 2022 | $3,647,020 | 1,418 | $2,572 | −37% |
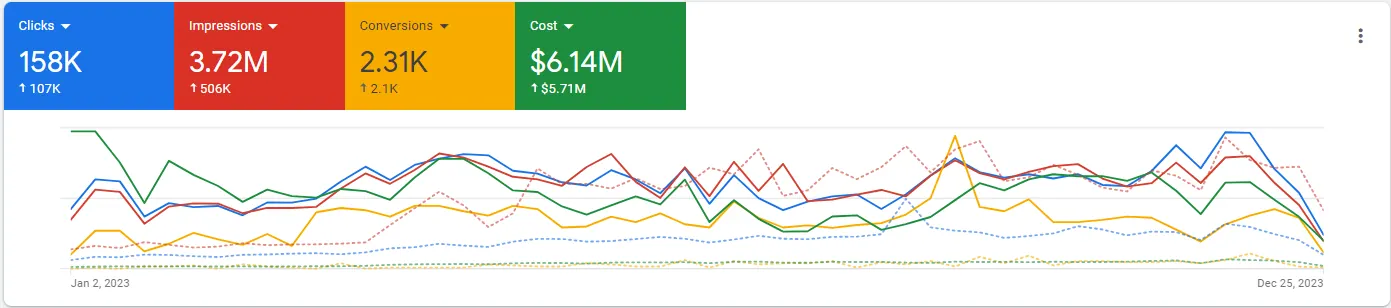
| 2023 | $6,141,683 | 2,309 | $2,660 | +63% |
| Total | $18,627,878 | 12,786 | $1,457 |
*The 2017 cost is calculated from the 2018 year over year change reported in Google Ads.
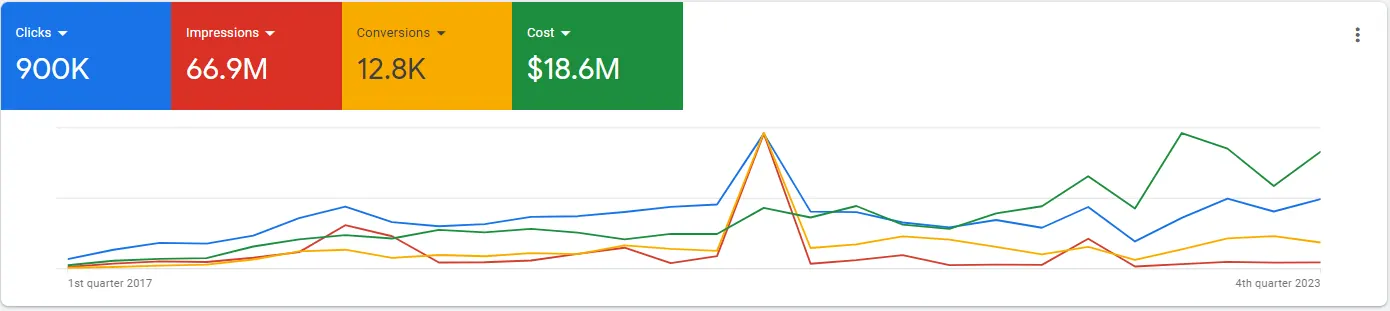
The account went through three phases: fast growth from 2017 to 2020, a change of direction in 2021 and 2022, and a return to growth in 2023.
Year by year
2017: proof of concept
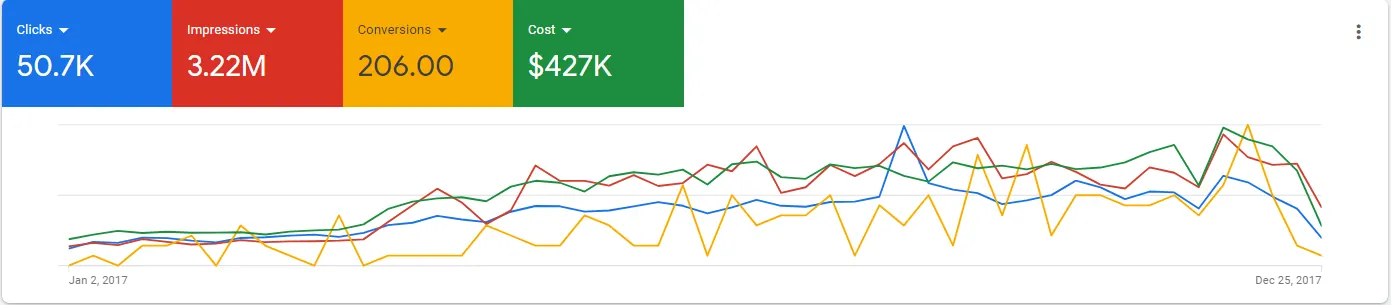
The first year had 12 campaigns: 11 Search campaigns and a Display remarketing campaign that started in the third quarter. The first quarter was a learning phase and produced 20 conversions. By the fourth quarter, conversions were 330% higher than in the first and cost per conversion had dropped 28%.
2018: scale
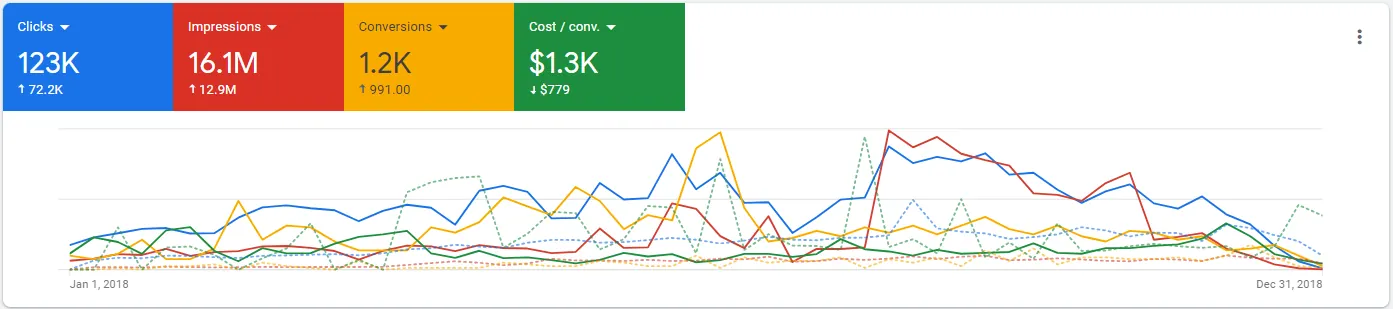
We added 48 campaigns. Every product and service now had its own campaign and its own landing page. Cost grew 263% and conversions grew 481%, so cost per conversion dropped 38%.
2019: focus on what converts
The client’s marketing goals changed, and we paused the campaigns that did not bring conversions at a good cost. Search conversions grew 27% and made up for the Display campaigns that stopped, so total conversions stayed flat.
2020: the best year for efficiency
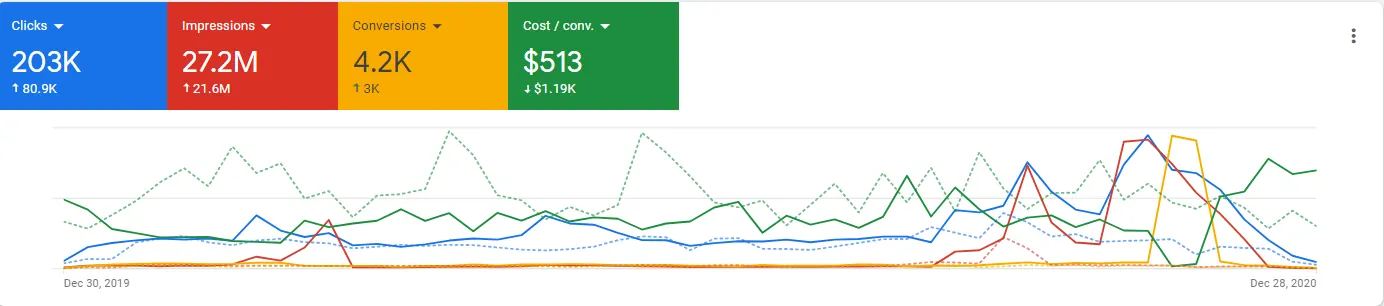
We closed old campaigns that underperformed and launched 18 new ones. Spend grew only 6%. Conversions grew 251%, and cost per conversion dropped 70%, to $513.
2021 and 2022: a change of direction
Company priorities changed and new campaigns launched a new product in several regions. The client expected fewer conversions during this shift and kept spending to limit the drop. Conversions fell 46% in 2021 and 37% in 2022.
2023: back to growth
The company returned to its earlier goals. We closed the new product campaigns and kept the best of the old ones. Conversions grew 63%, and cost per conversion stayed almost flat, even though the average cost per click had risen from $10.61 in 2020 to $38.84.






What made it work
- Campaigns tied to business goals. Each campaign was linked to the sales target of one department.
- One campaign per service. Each service had its own budget and landing page, which showed where to move the budget.
- Constant testing of campaign types, ad versions and bidding strategies.
- Market and competitor monitoring in the US and the UK.
- Clear communication. When priorities changed, we discussed the impact on results before we changed the account.
| Metric | 2017 | 2023 | Change |
|---|---|---|---|
| Ad spend | $427,700 | $6,141,683 | +1,336% |
| Conversions | 206 | 2,309 | +1,021% |
| Cost per conversion | $2,076 | $2,660 | +28% |
Our role
We built the Google Ads account from zero and managed it for seven years. Our founder led this engagement before SEO Catalyst was formed.